Dr. Hodaya Lampert and Dr. Guy Elaad
Audit Managers in the Social and Welfare Audit Division
Abstract
Performance Audits are an important tool for enhancing the efficiency of audited entities’ processes and work mechanisms and improving the services provided to the public.
However, Performance Auditing has several drawbacks: the absence of rigid evaluative norms, difficulties in recommending to the Audited entities ways to Improve Its Work, reaching a consensus with it on aspects that need to be improved in its work processes, and potential deficiencies in the audit team’s expertise. Analyzing administrative data through advanced statistical methods, specifically utilizing machine learning algorithms, may address these deficiencies and facilitate a professional, high- quality, and reliable performance audit.
This article will review various machine learning algorithms and their potential applications in performance auditing, demonstrating them through the report on “Government Handling of NEET Among Young People in Arab Society”.
Introduction
The International Standards of Supreme Audit Institutions (ISSA) delineates three types of audits:
(a) Compliance Audit, which assesses whether the audited entity adheres to the established normative framework1;
(b) Financial Audit, which evaluates whether the financial information presented in reports aligns with relevant reporting regulations; and (c) Performance Audit, which determines whether government obligations, actions, plans, or public organizations operate according to the principles of economy, efficiency, and effectiveness, while identifying opportunities for improvement2.
Performance Audit may also be referred to as a cost- benefit audit, efficiency audit, operational audit, project audit, or value-for-money audit.
In practice, a performance audit represents an independent, objective, and reliable evaluation of specific aspects of one or more of the following elements:
(a) Economy – the capacity to generate the same output with a lower input.
(b) Efficiency – the capacity to enhance output from a specified input.
(c) Effectiveness – the capacity to attain results in alignment with established policies or objectives.
A significant advantage of a performance audit is that it serves as a crucial tool for audited entities to optimize their processes and operational mechanisms, thereby improving performance and enhancing services to the public.
While performance audits offer notable advantages, they also present three disadvantages that may impact their effectiveness3.
a. Lack of Rigid Norms – unlike compliance and financial audits, which adhere to established and agreed-upon standards, performance audits operate with norms that are “soft”, flexible, and subject to change. The primary objectives focus on the efficient use of public funds and the effective implementation of decisions and plans by the audited entity. However, the realization of these goals largely depends on the audit team’s perspective and its interpretation of the success indicators of goals and objectives.
b. General and Vague Recommendations – the absence of strict norms in performance audits hampers the ability to provide precise recommendations to enhance the audited entity’s operations.
Furthermore, the audit team may lack expertise in the specific domain of the audited entity, leading to recommendations regarding efficiency improvements that could be contentious and impractical.
c. Limitations of the Audit Team – to convincingly prove the existence of insufficient savings and efficiency in the audited entity, the conducting of a performance audit requires a diverse skill set, including proficiency in innovative audit and analysis techniques and in-depth knowledge of the audit subject. An audit team that is not sufficiently skilled may be perceived by the audited entity as an incompetent team, undermining the credibility of their conclusions and recommendations.
The above three disadvantages of performance audits, must be carefully considered and managed.
This article will provide insights into the practical applications of machine learning methods in audit work, highlighting how the analysis of administrative data through advanced statistical methods, particularly machine learning algorithms, can overcome these challenges paving the way to the professionalism, quality, and reliability of performance audits.
Utilizing Administrative Data in Performance Audits
Administrative data such as income tax records, matriculation grades from the Ministry of Education, and employment data from National Insurance Institute, are data collected in government ministries and auxiliary units for management, documentation, and registration purposes, and are instrumental in policy planning, the provision of government services, tax collection and more4.
In the context of performance audits, administrative data offers five key advantages over data obtained through surveys or interviews:
a. Selection Bias – administrative data is collected from the entire relevant population rather than a sample, ensuring a more accurate reflection of reality without biases5.
b. Scope of Data – the extensive scope of administrative data enhances statistical reliability and facilitates the examination of various statistical relationships among different variables (which may not necessarily indicate causal relationships) 6.
c. Access to Data – the Privacy Protection Law, 1981, regulates the operations of databases containing private and sensitive information. Under this law, the audited entity is not guaranteed access to administrative data from sources other than itself, thus barring cross-referencing of data with other organizations. Conversely, the Basic Law: State Comptroller, enables the Office of the State Comptroller to request relevant data from all audited entities and, when feasible, to cross-reference such data to establish a unified database. Thus, in the audit work, data is gathered from multiple information sources, and following thorough processing and analysis, findings can be reached that may be beyond the capability of the audited entity to ascertain.
d. Data Veracity and Timeliness – administrative data are collected in real time, ensuring they are current and accurately reflect the circumstances at any given moment.
e. Objectivity Versus Subjectivity – Administrative data are considered reliable and objective, devoid of emotional or subjective bias that can affect responses obtained through surveys and interviews, when such subjective input does not consistently yield a reliable or neutral representation of the situation.
Therefore, utilizing administrative data in performance audits may mitigate inherent barriers, as these data facilitate quantitative, precise, and dependable measurements within the audited entity. Moreover, analyses of administrative data can yield clear and measurable conclusions regarding the entity’s effectiveness in executing its policies as well as the attainment of defined goals and objectives. Based on these data-driven conclusions, actionable recommendations can be developed, such as strategies to bridge the gaps between the current state of the audited entity and its desired objectives.
Methods for Analyzing Administrative Data
In social sciences studies, particularly within economics, methods have been developed for the analysis of administrative data. These methods include descriptive statistical techniques, such as calculating averages, medians, and characterizing the distribution of variables. Additionally, more advanced statistical tools are employed to test hypotheses regarding potential relationships among various variables.
A fundamental approach for identifying relationships between variables is regression analysis. This technique investigates how variations in the explained variable (dependent variable) are influenced by changes in the explanatory variable (independent or predictor variable)7 . Thus, in this analytical method, selecting explanatory variables is crucial, and the relationships between these explanatory variables and the explained variables must be thoroughly evaluated.
Regression analysis must recognize that the selection of explanatory variables may overlook other relevant statistical relationships not included in the analysis. The United States General Accounting Office (GAO) advocated for the use of regressionanalysisasanauditingtoolasearlyas1972,illustratingitsapplicationinpredictingoxygenlevelsthatmightresult from increasing municipal sewage volumes along the Missouri River’s main tributary.
This statistical analysis facilitated an evaluation of the economic viability of implementing new technologies in sewage drainage systems8 .
Utilizing Machine Learning to Analyze Administrative Big Data
When the volume of administrative data reaches significant levels, it is classified as “big data”9. Big data consists of vast collections of information, often comprising millions or billions of observations10, each with numerous characteristics. One distinguishing feature of big data databases is their capacity to implement mathematical machine learning (ML) models. These models enable computers to emulate human cognition by identifying systematic patterns within the data characteristics and making predictions based on learned examples. Machine learning methodologies provide a more objective approach to data analysis, displaying lesser reliance on researchers’ biases compared to traditional methods such as regression analysis. Below, we present an application of a machine learning methodology in conducting an audit using big data11. This methodology was first applied in Israel in the audit report titled “Government Handling of NEET Among Young People in Arab Society” (the Report)12. The audit team evaluated data collected over an 11-year period from diverse sources, encompassing demographic, income, employment, education, and crime data, among others. Approximately 1.6 million observations were analyzed, with 800 characteristics associated with each observation.
Machine learning methodologies encompass various algorithms that enhance the efficiency, accuracy, and effectiveness of the audit process. Below we shall out line several common machine learning algorithms that were implemented in this Report.
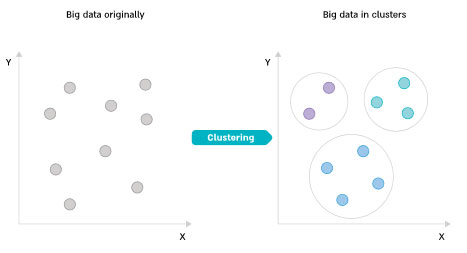
Cluster Analysis–analgorithm that organizes data into clusters(groups) based on similarities in characteristics, typically using Euclidean distance calculations 13.
These characteristics may include factors such as religion, race, gender,andage. The audit recognizes the value of cluster analysis in tailoring treatments to the specific characteristics of identified data groups.
For instance, it can assess the appropriateness of welfare services for defined population segments. However, it is important to consider that the complexity of reality may necessitat ealternative classifications of the data, which could yield insights beyond those identified by the audited entity.
On the following page is a descriptive diagram illustrating the principle of cluster analysis.
Diagram 1: Cluster analysis
One of the audit questions in the Report focused on whether the government’s response to NEET among young Arabs is tailored to the characteristics of various subgroups of NEET youth. To address this, the audit team conducted a cluster analysis utilizing all available data to differentiate between subgroups of NEET young Arabs. The audit team employed the DBScan and KMeans models14, which led to the identification of three distinct groups within the population of NEET young Arabs in Israel. The following maps illustrate the geographical distribution of idle young Arabs, categorized by cluster. As the map color transitions to red, the density of idle youth increases. Based on the existing data and the algorithm used, each observation (an idle Arab youth) was classified into one of the three clusters: Cluster 1 – Idle young individuals from a relatively high socio-economic status, characterized by a high rate of matriculation eligibility and psychometric (SAT) test participation, along with a low crime rate; Cluster 2 – Primarily young people from the Bedouin sector in the Negev; Cluster 3 – All remaining idle young Arabs.
Diagram 2: Idle youth within the Arab society, according to cluster analysis
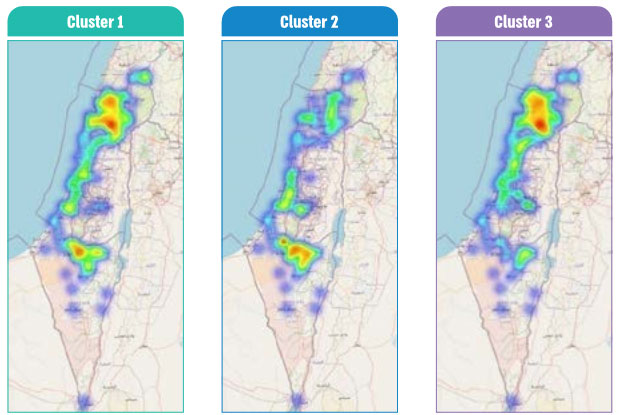
The maps of clusters 2 and 3 indicate a significant concentration of idle young individuals in the country’s southern region (cluster 2) and the country’s northern region (cluster 3). Through big data analysis and the application of the cluster analysis algorithm, it is feasible to identify differentiated groups with minimal internal variation, allowing for tailored government interventions for each group. Consequently, the audit team supplied government ministries with a valuable tool that directs attention towards the main issues characterizing each subgroup among idle Arab youth.
Decision Trees – an algorithm designed for predicting data classification. The audit team recognizes the crucial role of future view auditing. The ability to forecast future trends based on specific policies offers significant added value. This algorithm constructs a model that implements a series of straightforward decision rules to classify data, learning from examples. An audit team can classify of high and low risk to predict the likelihood of fraud in particular areas or to assess the risk of disease based on patients’ background variables. The Report employed a decision tree model to predict idleness among young Arabs, utilizing data collected up to the 8th grade.
The model’s purpose was to provide a tool for the Ministry of Education, when it came to investing resources in children at high risk of being idle between the ages of 18 and 24, to mitigate the phenomenon.
Below is a diagram of the decision tree model derived from big data analysis.
Diagram 3: Decision tree – predicting idleness amongst young Arabs
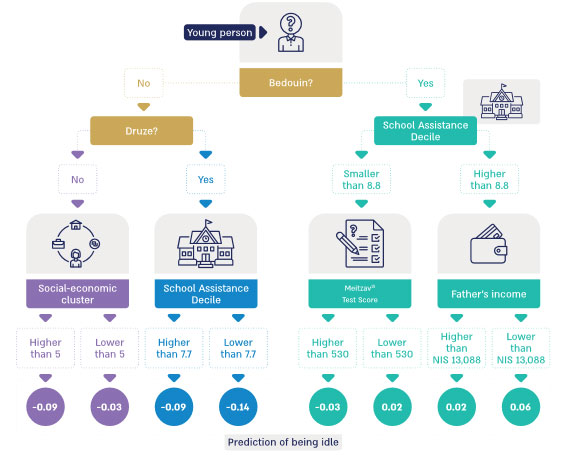
Diagram 3 indicates that the highest probability of a youth being idle is associated with a Bedouin student whose school assistance decile16 is higher than 8.8 and whose father’s annual income is below NIS 13,088. Conversely, the lowest probability of youth idleness is observed in a Druze student whose school assistance decile is below 7.7. The model accurately predicts a student in the 8th grade’s likelihood of idleness at ages 1920 with an accuracy rate of 71%17.
Given these findings, the significance of the Ministry of Education, which is responsible for the early identification of children at risk of idleness, is enhanced. The audit team recommended that the Ministry allocate resources and programs towards children with a high likelihood of idleness, particularly Bedouin students and those from low socio-economic backgrounds. Furthermore, the Ministry was advised to develop a model for monitoring and diagnosing children at risk of being idle in adulthood, based on their characteristics and social affiliations.
Nearest Neighbors Model
The K-Nearest Neighbors (KNN) algorithm is employed to predict the classification of a specific observation based on similar observations (neighboring observations). The parameter “k” denotes the number of neighbors considered by the algorithm. KNN is utilized in video image recognition, stock analysis, and handwriting recognition; However, its primary disadvantage is the high computational power it requires. The Report applies a K-Nearest Neighbors model to predict the missing Meitzav (efficiency and improvement index) test scores of certain young individuals, evaluating language, science, and English skills in the 5th and 8th grades. Annually, assessments are conducted in a sampled manner, only in selected schools, resulting in only some students in the selected schools being evaluated on limited subjects, and in some students not being tested at all. to use the Meitzav data in analyzing data for the entire population, it was necessary to complete the missing scores using the KNN model. In this algorithm, the missing grades were predicted based on the average scores of three students who took the test and were most similar to that young person in other variables.
Diagram 4: Nearest Neighbors – predicting the missing Meitzav scores
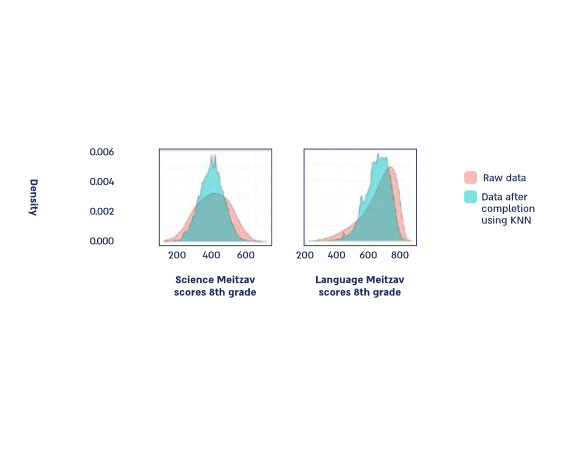
In Diagram 4, the distribution of raw data is compared to data processed using a nearest neighbor model. The scores of students from the Ministry of Education’s 8th grade Meitzav tests are represented in pink, while the blue indicates the scores of all students following the completion of the algorithm. The chart on the right illustrates the scores from the science test, encompassing approximately 140,000 examinees and around 1.6 million scores after completion. The chart on the left presents the scores from the language test, which includes approximately 80,000 examinees and about 920,000 scores after completion18 .
The diagrams suggest that the K-Nearest Neighbors model maintains a consistent distribution of grades while significantly expanding the database19.
Consequently, predictions for all Meitzav grades for every student were achievable, facilitating the estimation of idleness among young Arabs.
In addition to the algorithms applied in the Report and presented above, there are further algorithms that audit teams can consider for inclusion in future audit reports. Below are two recommended algorithms.
Anomaly Detection – this algorithm is employed to identify data points that significantly deviate from the norm. For instance, it can be utilized to detect budgetary irregularities in a financial audit by pinpointing anomalies within a series of invoices or financial reports.
Additionally, this algorithm can be applied in cyber auditing through penetration tests, allowing for the identification of vulnerabilities within information security systems.
Neural Networks – these algorithms, modeled on the structure of the human brain, are applicable across various tasks, such as image recognition, speech decoding, and natural language processing.
Audit teams can leverage neural networks to process and analyze extensive amounts of unstructured data, including text and images, thereby extracting valuable insights.
For example, neural networks can assess discourse in social media to identify public sentiment trends toward audited entities.
In audit reports regarding the Covid-19 pandemic, social media discourse was monitored to detect shifts in public sentiment regarding the audited entities and to identify public tendencies toward misinformation, though this monitoring is currently conducted manually.
The implementation of neural networks may enhance the efficiency of monitoring social media discourse by providing comprehensive analysis compared to limited samples, resulting in reliable outcomes devoid of subjective biases in discourse selection.
Another application of neural networks in auditing involves making quantitative inferences from extensive document collections. It may be necessary to code a large database of protocols or agreements within text files and establish a database that facilitates quantitative analysis that is absent in the audited entity. A neural network algorithm for natural language analysis and understanding can execute this task efficiently and reliably.
Extracting Root Causes Through Machine Learning
An audit team often focuses on identifying the root causes of various phenomena, such as declining employment rates, increasing waiting times for medical appointments, rising student dropout rates, and growing crime rates among minority groups. During the audit process, these phenomena are assessed using qualitative methods, including surveys, public engagement, and roundtable discussions. However, insights derived from these tools may be biased due to them being based on subjective feelings (different worldviews, different backgrounds, prejudices, etc.) of the participants and the audit team, which do not always accurately reflect reality and may consciously or inadvertently compromise the objectivity of the audit. Additionally, the selected sample for surveys or public participation may not be representative, encompassing individuals with unique traits that influence their decision to engage in a survey or public participation process. Machine learning algorithms can significantly aid in identifying the primary causes and factors underlying the examined phenomena through predictive analyses and “reverse engineering”. Reverse engineering in a machine learning model for prediction enables an objective interpretation devoid of biases and preconceived notions. In this process, the contribution of each characteristic in the database is calculated to determine predictions, subsequently allowing for the ranking of data characteristics based on their impact in explaining the observed phenomenon. By employing reverse engineering tools, a more objective assessment of the primary root causes can be established. In the Report, the root causes of idleness among youth in Arab society were identified by calculating the “Shapley value”20 of a decision tree within the prediction model for idleness in 8th grade pupils. Diagram 4 below presents the variables utilized in the decision tree model in descending order of contribution, with red indicating a high variable value and blue indicating a low variable value.
Diagram 4: Variables for predicting idleness among Arab youth
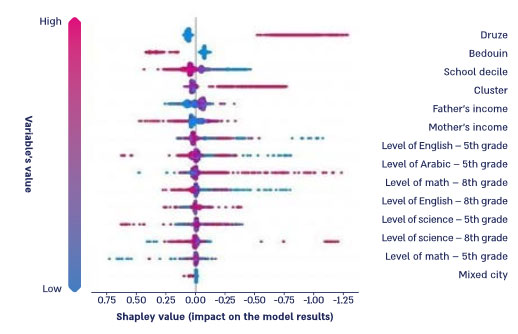
The diagram indicates that the primary marginal contributor to predicting idleness among young Arabs is sectoral affiliation: Druze, Bedouin, or Arab. The marginal contribution associated with belonging to the Druze sector is negative, thereby decreasing the likelihood of idleness, while belonging to the Bedouin sector has a positive marginal contribution, increasing the likelihood of idleness and highlighting the necessity for targeted interventions within Bedouin society. Additionally, socio-economic status variables, such as school assistance decile, socio- economic cluster of the local authority, and parental income (mother and father) – exert a more significant influence than the variable of educational attainment, as measured by the Meitzav test scores.
Challenges in Integrating Machine Learning Models in Audit Work
One prominent challenge in performance audits is the professional limitations of the audit team21. This issue becomes more significant with the analysis of administrative data and the application of machine learning methodologies. Data analyses that do not adhere to established academic standards may produce biased results devoid of scientific validity. To address this challenge, audit teams must receive training and develop the necessary skills to analyze administrative data, especially big data. Another challenge lies in the requirement for appropriate technological infrastructure. Effective analysis of big data necessitates capabilities for substantial data storage, advanced software for analysis, and adequate computing resources to perform such analyses.
This issue is particularly evident when dealing with sensitive data, which must be analyzed within the corporate network and cannot be processed using the existing online infrastructure. Additionally, legal challenges complicate access to sensitive individual data, including information related to education, employment, health, and welfare. This data must be stored under classified permissions to ensure it is used solely for audit-related purposes. It is also important to approach data collection proportionately, obtaining only that data from audited entities which is likely to contribute meaningfully to the audit process.
Summary
A quality audit is designed to optimize processes within government organizations and enhance the functionality of government ministries and their auxiliary units. To achieve this, audit teams must employ updated methodologies during performance audits, which include the analysis of administrativedata through advanced statistical research methodologies.
These methodologies enable objective analyses free of biases and yield quantitative indicators for evaluating public system outputs. Furthermore, based on the findings and conclusions from the audit, practical recommendations can be formulated to bridge the gaps between desired outcomes and present realities, thereby improving the operations of public entities and elevating the services rendered to the public.
1International Organization of Supreme Audit Institutions (INTOSAI), ISSAI 400, Compliance Audit Principles (2019), https://www.intosai.org/fileadmin/downloads/documents/open_access/ISSAI_100_to_400/issai_400/ISSAI_400_en_2019.pdf.
2International Organization of Supreme Audit Institutions (INTOSAI), ISSAI 300 Performance Audit Principles (2019), https://www.intosai.org/fileadmin/ downloads/documents/open_access/ISSAI_100_to_400/issai_300/ISSAI_300_en_2019.pdf.
3Ornit Tsirkin “Performance Audit of State Audit in Israel on Social Issues: The Complexity of Audit and a Comparative Perspective”, Mar’ot: Studies in State Audit and Public Complaints 64 115 (2021). Two additional problems were presented in Tsirkin’s article, but they are less relevant to the subject matter herein.
4ADLS Administrative Data Liaison Service, Administrative Data Introduction (2016), https://web.archive.org/web/20160725114045/http:/www.adls.ac.uk/adls-resources/guidance/introduction/.
5When conducting surveys or interviews to collect information, respondents sometimes have the option to choose whether to participate in the survey or interview or not to participate. This option may affect the topic being investigated. Additionally, online opinion polls tend to under-represent populations with low computer access, and therefore the resulting sample is not representative and may bias the results, data analysis, and interpretation of the data.
6When random background noise is offset, according to the law of large numbers. Klesov Oleg, Limit Theorems for Multi-Indexed Sums of Random Variables (2014).
7In a regression analysis, a statistical relationship between variables is found, but this does not necessarily indicate causation. That is, the explanatory variable is not necessarily the cause of the change in the explained variable.
8Division of Financial and General Management Studies United States General Accounting Office, Regression Analysis as an Audit Tool: A Case Study (1972), https://www.gao.gov/assets/regression_Redacted.pdf.
9The amount of data required depends on the specific model you wish to implement.
10Observation – An entity in the database for which characteristics are collected.
11See also: Rivera Tiare, Machine Learning Application for SAIs, 50(2) International J. of Government Auditing 13 (2023).
12The State Comptroller “Government Handling of Idleness Among Young People in Arab Society” Report, 73C 141 (2023).
13The Euclidean distance between two points is the length of the straight-line segment between them. In a regression analysis, a statistical relationship between variables is found, but this does not necessarily indicate causation.
14 The DBScan model calculates the optimal number of groups according to the characteristics existing in the database. The KMeans model classifies the observations according to the Euclidean distance from the centers of gravity of the groups according to the number of groups.
15Meitzav - Efficiency and improvement index
16The ranking of schools in Israel is done by weighting the socio-economic index and family background of the students in that educational institution. The school assistance index ranges from 1 to 10.
17The prediction was made in a balanced sample, meaning that the probability in the balanced sample is the same for non-idleness and idleness.
18The language (Hebrew) scores do not include students who study in the Arab education system.
19Because the algorithm uses the average of nearby observations to “guess” the missing score, the distribution after completion has less variance than the one before completion, but has a similar shape.
20Shapley value – a concept in game theory that indicates, in a coalition situation (a group of players), the marginal contribution of each player to achievingthe group’s profit.
21Tsirkin, ibid, footnote 4.